
Salesforce’s true financial impact goes far beyond license fees. As your organization scales, the platform becomes a full economic system—shaping how work gets done, how quickly teams can move, and how expensive it is to change direction.
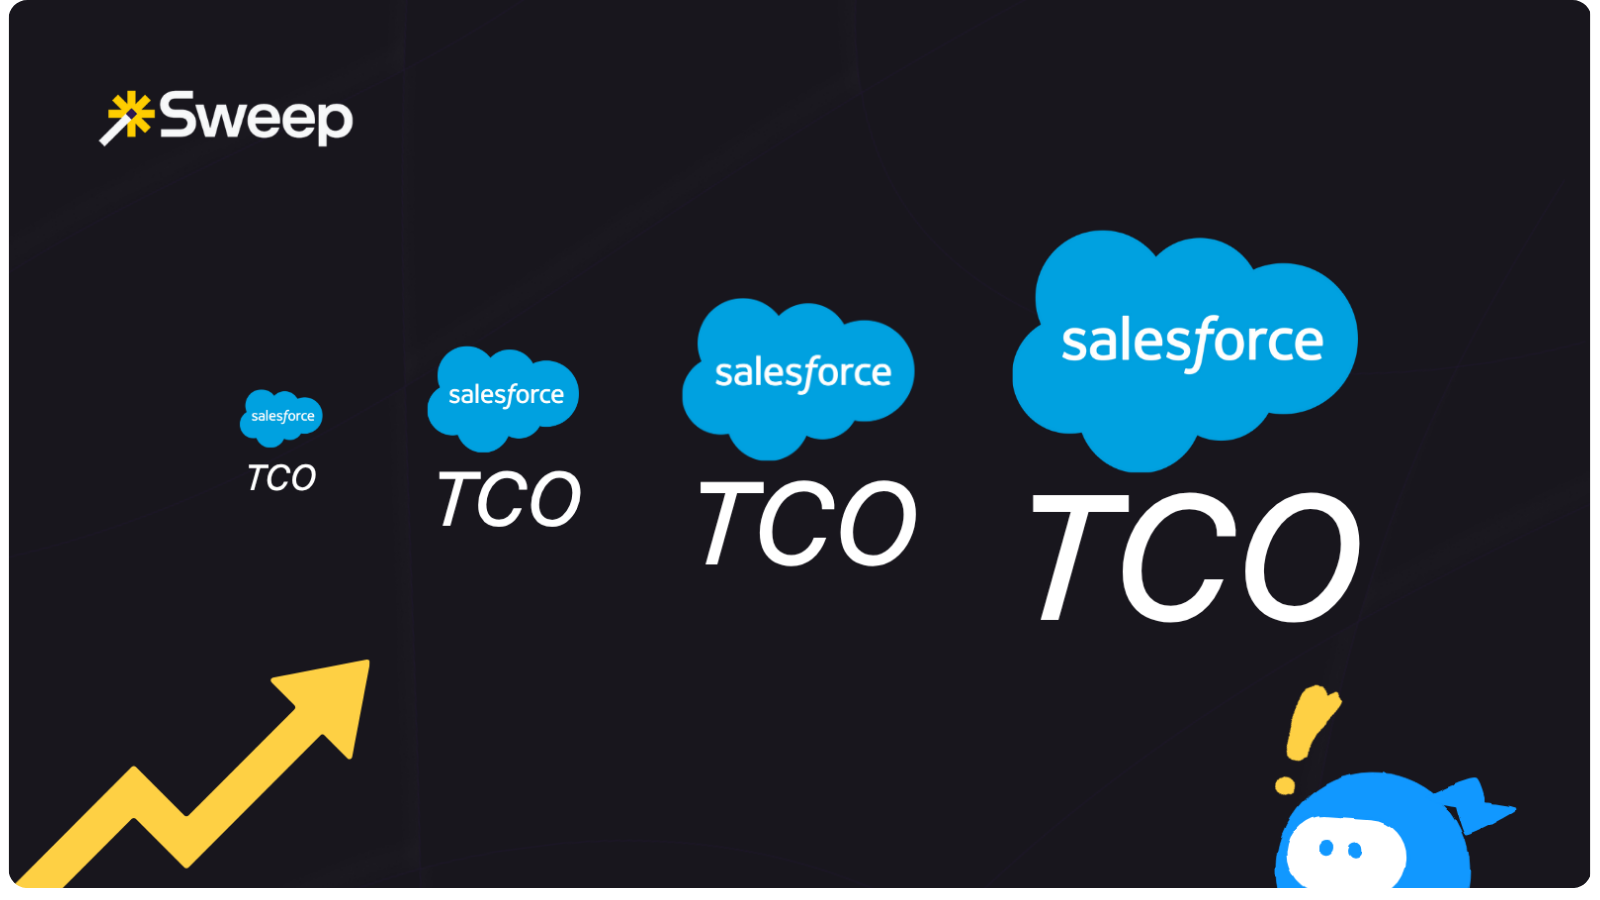
Looking at TCO across growth stages reveals a clear pattern: the mid-market inflection point (often around 200–500 users) is where costs start to spike.
Complexity piles up through customizations, integrations, and operational inefficiencies. What started as “just a CRM” becomes a major driver of both cost and risk.
This analysis maps the full picture from startup to enterprise:
Organizations that treat Salesforce as a strategic system — investing in platform consolidation, automation, and data governance — can realistically reduce TCO by 30–40% while accelerating time-to-value from their Salesforce investments.
Salesforce economics are a bit... of what you might call a "paradox."
On one hand, you get a powerful and flexible platform for customer management and GTM ops. On the other, the pricing model and near-infinite customization options can create unpredictable, escalating cost structures, especially as your business grows.
The big shift: Salesforce is not just a software expense. It’s a core business capability with direct impact on:
Traditional ROI decks usually stop at license costs and a handful of “uplift” metrics. They rarely capture the hidden complexity costs that appear as usage scales:
We think a serious TCO view has to include the full lifecycle of the platform: from initial rollout to the messy middle years where complexity peaks. That’s where the biggest financial impacts show up. Especially during growth transitions from basic CRM to a highly integrated, multi-cloud environment.
Salesforce uses a tiered, per-user pricing model that scales with both user count and feature set. It’s simple on paper and very expensive at scale.
For larger organizations (500+ users), annual licensing spend typically lands in ranges like:
For a 500-user org, baseline subscription costs alone can hit $1–2 million per year, before any add-ons.
Common add-on modules that expand that footprint:
By the time you stack these, it’s normal to see total licensing costs increase 40% to 100% over the base CRM subscription, especially in multi-business-unit environments. So yeah, double.
Initial implementation costs swing widely based on business complexity and/or maturity:
And that’s just the first pass. After go-live, most orgs layer on continuous customization and optimization, which typically adds 15–20% of the initial project cost per year in ongoing work.
A major driver here is consulting partner rates:
The important pattern: implementation is never truly “done.” New business requirements, Salesforce releases, and org changes all drive recurring projects.
Over 3 to 5 years, the total implementation spend often ends up 2 to 3x the original project cost, especially in fast-changing businesses and industries.
Once the system is live, operational costs quietly compound. Typical categories include:
For growing organizations, these costs don’t scale with only user count —they scale with complexity. More customizations, more integrations, more business units means more time, more people, more risk.
Over a 3–5 year window, total Salesforce TCO frequently lands at 2.5–4x the initial implementation cost, with 500-user organizations easily spending $3–5M+ over five years.
Operational debt is what happens when short-term workarounds become permanent business process.
You see it show up as:
In moderately complex CRM environments, research suggests that users lose around 20% of their time to these kinds of inefficiencies. That’s roughly one day per week, per user — an enormous productivity and cost hit that rarely shows up on your budget
Technical debt is the future cost you commit to when you choose “fast” over “right.”
In Salesforce, it tends to accumulate as:
The bill comes due during:
In one CPQ migration example, a Business Applications leader described having “two versions of CPQ running within the same CPQ,” buried under custom code—forcing a massive debt unwind before they could move forward. For mid-sized orgs, this kind of remediation often requires 6–12 months of work and $200,000–$500,000 in spend.
AI is a force multiplier.
Or a money pit.
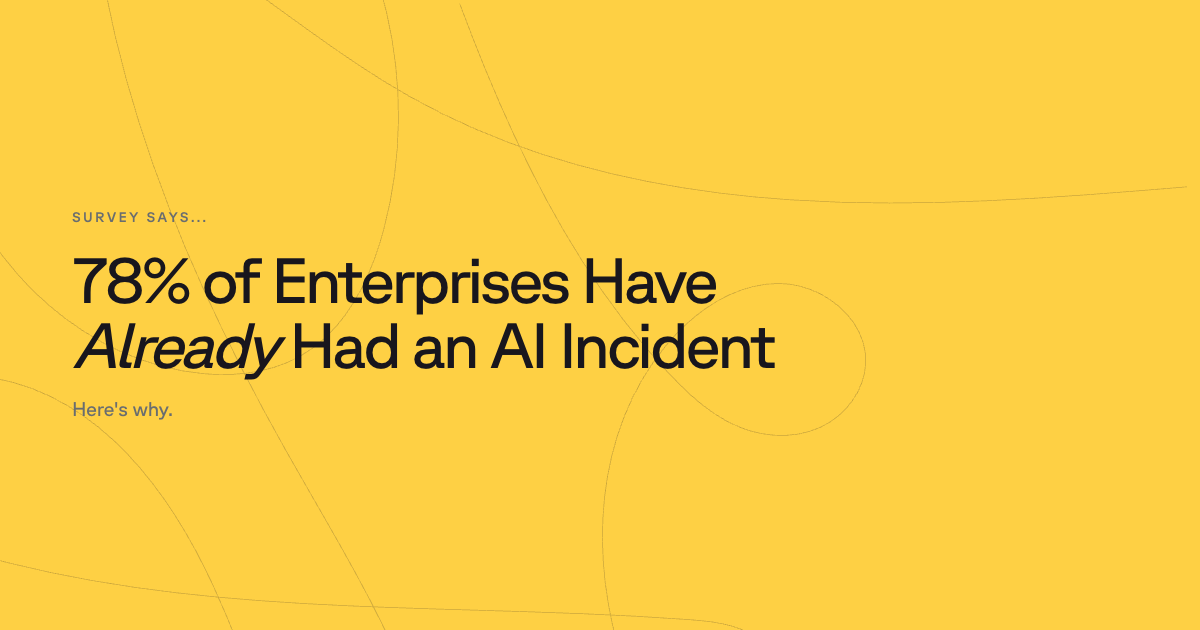
Industry-wide, roughly 80% of corporate AI initiatives fail to meet expectations. The main reasons:
The financial impact is twofold:
Given that Salesforce’s AI and Data Cloud products represent significant ARR exposure, failed or stalled projects can quickly become one of the largest hidden contributors to overall TCO.
As we said, the mid-market inflection point usually appears somewhere between 200–500 Salesforce users (your mileage may vary based on complexity and growth rate).
At this stage, a few things typically happen at once:
One Salesforce CPQ leader described their legacy implementation as “a terrible root that seemed to kinda go everywhere.”
That’s exactly what this inflection point looks like: a root system spreading into everything, but without intentional design.
Orgs nearing or crossing this inflection point usually show a similar set of early warning signs:
If you hit this stage without a plan, the financial fallout can be absolutely brutal. It’s not uncommon to see 40–50% escalations in TCO as teams attempt to fix foundational issues while still shipping features.
A stark example: one Director of IT reported spending $750K and two years unsuccessfully trying to connect Salesforce CPQ, Conga, and DocuSign before changing course.
Platform consolidation is a popular “clean up your room” approach: rationalize the org, remove clutter, and standardize where possible.
Key financial elements:
Organizations that run post-implementation audits every quarter see roughly 19% higher CRM ROI over 24 months, which aligns with what you’d expect when you continually chop and prune complexity instead of letting it grow wild, free, and unchecked.
Typical payback period: 12–18 months, with the biggest upside for orgs that grew fast and customized everything along the way.
When the platform is fundamentally misaligned with business needs, vendor transition becomes an option. Though it’s the most disruptive route.
A few important economic factors:
Some analyses show that while Salesforce offers a lower initial investment and faster time-to-market, custom private cloud solutions can become more cost-effective over the long term for organizations with 500+ users and highly specific requirements.
Reality check: the breakeven point here is usually year 3–4, so this is a long-horizon strategy, not a quick fix.
When the data foundation is solid, AI and automation can materially move both revenue and cost metrics.
Reported outcomes include:
The pattern among successful programs:
Teams using Salesforce Einstein for predictive insights have reported around a 29% increase in win rates, which shows how targeted AI can contribute directly to top-line performance.
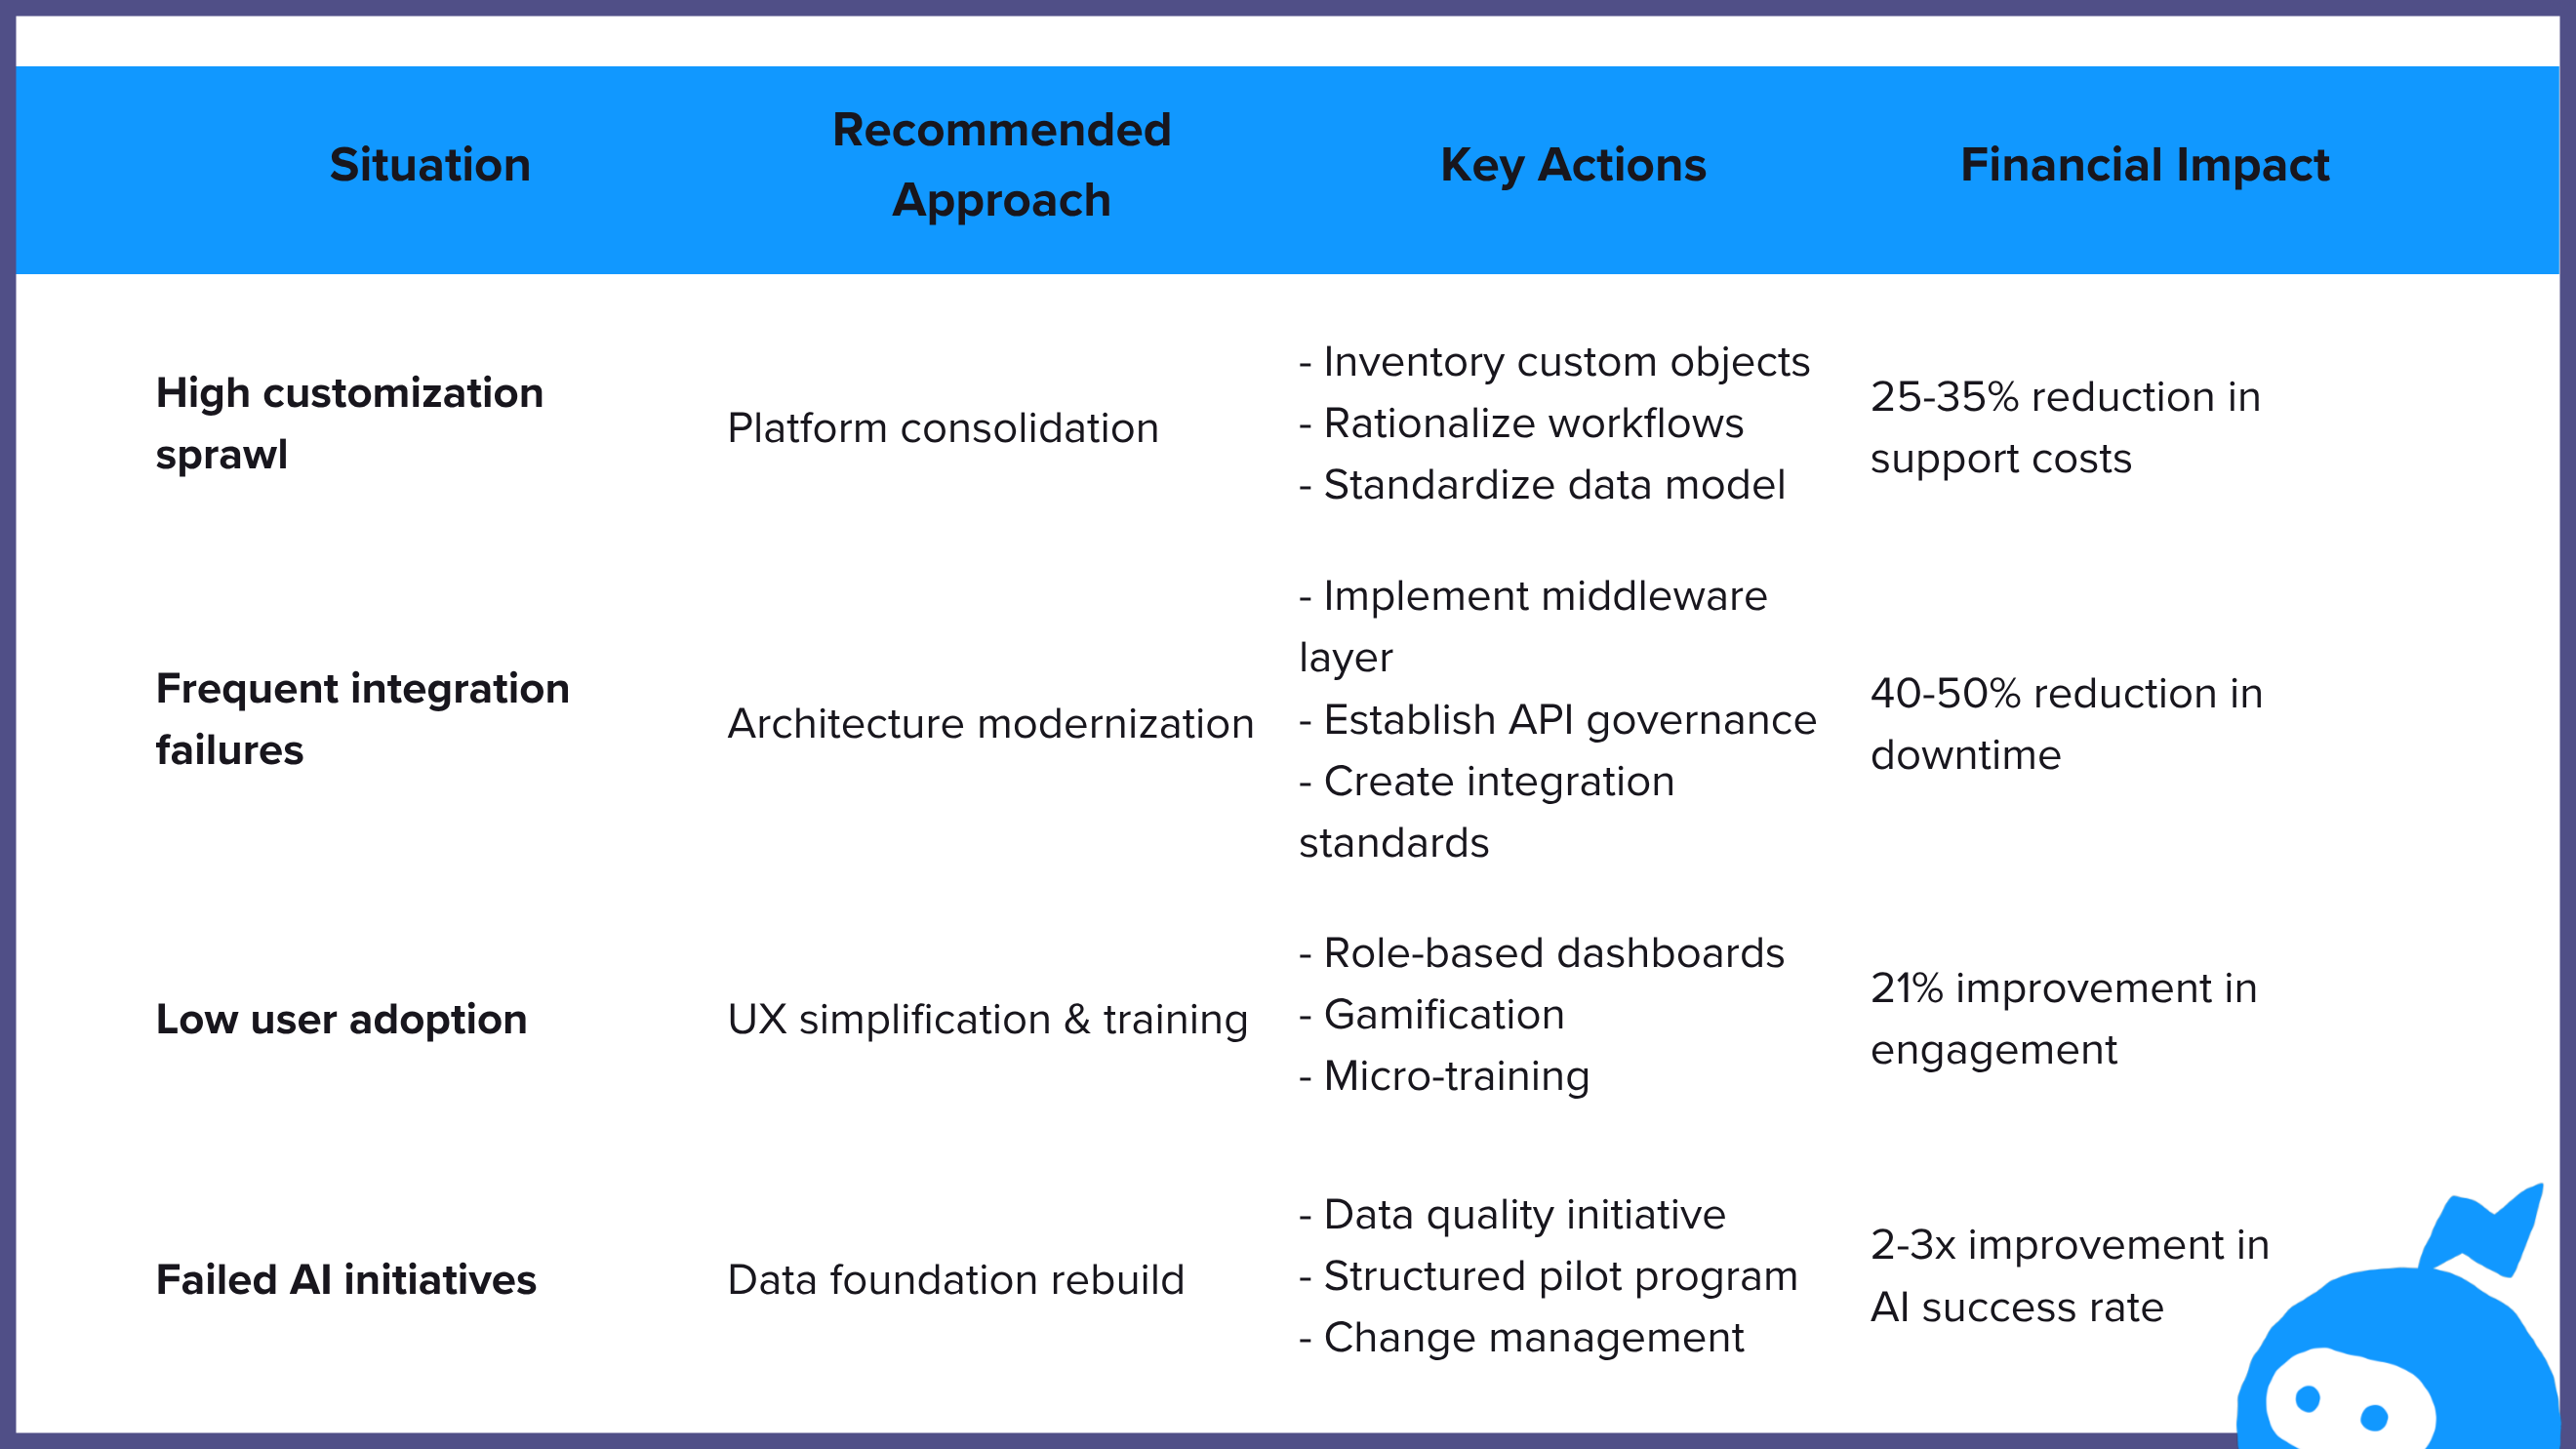
A structured decision framework helps match the right TCO strategy to the actual problem instead of reacting tactically.
A practical TCO model should capture both direct and indirect costs over at least the next 3–year window. Important buckets to include:
Direct Cost Categories
Indirect Costs
ROI Calculation Components
Two useful meta-metrics (how apropos):
Healthy Salesforce programs often show an average ROI around 215% with a payback period near 13 months, which can serve as a benchmark for evaluating the solidity of your own economics.
The throughline here is simple: Salesforce TCO is not a one-time conversation. It’s more like an ongoing discipline.
Across growth stages and use cases, a few strategic principles consistently separate high-ROI implementations from high-drag ones.
Salesforce economics are evolving again with the rise of AI and agentic automation. Platforms like Agentforce are already generating meaningful ARR and closing thousands of deals, signaling growing demand for AI-native operations.
The next phase of TCO management will need to account for:
The organizations that win here will treat Salesforce as a strategic value platform — intentionally balancing investment, complexity, and capability across each growth stage.
Handled that way, TCO stops being a reactive “why is this so expensive?” conversation and becomes a proactive lever for how your business grows.
If all of this sounds like a metadata and complexity problem, that’s because it is. Sweep is built to attack Salesforce TCO at the root: the tangled metadata, opaque dependencies, and accumulated systems drag that make every change slower and more expensive than it should be.
Here’s how Sweep fits into the picture:
Sweep’s metadata agents continuously map your Salesforce (and connected systems) so you can actually see:
Instead of doing “impact analysis” with spreadsheets and tribal knowledge, you get a live, queryable model of your org.
Because Sweep understands your metadata and dependencies, it can:
The net effect: fewer broken releases, way less firefighting, and a steady reduction in the “invisible tax” of systems drag that inflates TCO over time.
At the 200–500 user stage, most orgs are flying blind. Sweep gives you:
That’s exactly the window where complexity costs start to spike. Sweep’s whole job is to keep that curve from going exponential.
AI fails when the underlying data and systems are a mess. Because Sweep operates at the metadata layer, it helps you:
In other words: Sweep helps you get your Salesforce house in order so your AI investments don’t become another line in the “indirect costs” column.
Finally, Sweep turns TCO management from a one-off spreadsheet exercise into an ongoing operational practice:
Instead of arguing about whether Salesforce is “too expensive,” you can show exactly which parts of the system are driving cost—and what you’re doing about it.
Sweep doesn’t replace Salesforce. It makes Salesforce behave like the strategic asset the business thought it was buying in the first place.